
When to Use Statistical Tests in Psychology?
When to Use Statistical Tests in Psychology?
Imagine yourself as a researcher who has conducted a study and now wants to find out the results. Your research focuses on anxiety, and the intervention that was used with participants was cognitive behavioural therapy (CBT). You are interested in knowing if CBT helped in reducing the system of anxiety among patients during six weeks. How would you know if the CBT was effective? Well, this is where we need to run some psychological statistical tests.
In this blog post, we’ll discuss the significance of using statistical tests in psychology. We’ll also highlight various types of statistical tests you can conduct in studies related to psychology.
Psychology Statistical Test
In psychology, statistical tests are like tools that scientists use to understand the information they gather from experiments. These tests help them figure out if the results they see are really because of what they did in the experiment or if they could just be random chances from the hypothetical results.
There are different types of parametrics that psychologists use, depending on the kind of data they have. One is the parametric test (when data is normally distributed), and the second is the non-parametric test (when data is not evenly distributed). These tests help psychologists make sense of the information they gather during their experiments. So, whether it’s comparing different treatments, understanding how people behave, or exploring the workings of the mind, statistical tests are essential tools for psychologists to understand the world around us.
Statistical Test Importance
Statistical tests are essential in psychology research as they play an important role in identifying if the alternative and null hypothesis should be accepted in experimental research. These tests are employed to ascertain whether the observed differences or relationships in data are statistically significant or due to chance.
When scientists conduct experiments, they collect the data and run statistical tests to see if the results are important or just due to random chance. If the results are significant, it means that the alternative hypothesis is more likely to be true, and the null hypothesis is probably wrong, and it would be rejected.
This information is valuable because statistical tests allow researchers to compare the results with what others have found before.
Types of Statistical Tests
There are two types of statistical tests: parametric and non-parametric.
Parametric Statistical Tests
Parametric tests are a type of statistical method used to test hypotheses in psychology research. However, specific criteria must be met to ensure the reliability of these tests:
- Normal distribution: The data should follow a normal distribution, meaning the scores are evenly distributed around the mean in a bell-shaped curve
- Homogeneity of variance: This means that the amount of ‘noise’ or potential experimental errors should be similar in each variable and between the groups.
- Outlier: Extreme outliers can uneven the results of parametric tests, so it’s important to identify and address them.
- Independence: Each data participant in each variable should be independent of others. Measurements from one participant should not be influenced or associated with measurements from other participants.
Types of Parametric Tests
In psychology, researchers use statistical tests to analyze data and draw conclusions. Parametric tests are one type of statistical test used when certain conditions are met. There are different types of parametric tests, and which one to use depends on what the researcher wants to find out.
Correlation
Correlation is about understanding the relationship between two variables. It tells us if they are connected, and, if so, how strong that connection is and whether it is positive or negative. For instance, the relationship between fitness test scores and the number of hours spent exercising.
Paired T-Test
A paired t-test is used when we want to compare the mean value of two variables from the same participants. It helps us see if there is a significant difference between two sets of data. For instance, the difference in depression scores for the same group of patients before and after they undergo treatment.
Unpaired T-Test
An unpaired t-test is used when we want to compare the mean values of two variables from different groups. It helps us determine if there is a significant difference between two separate groups. For instance, the difference between depression symptom severity in a group of patients receiving a placebo and another group receiving drug therapy.
One-Way Analysis Of Variance (ANOVA)
ANOVA compares the mean of two or more separate groups. It uses a between-subject design, and the independent variable needs to have three or more levels. For instance, comparing the difference in average fitness test scores between the people who exercise frequently, moderately, or not at all.
One-Way Repeated Measures ANOVA
With the one-way repeated measures, you compare the average of traits or measurements within three or more conditions using the same group of people. For instance, comparing the difference in average fitness test scores in the morning, afternoon, and evening.
Non-Parametric Tests
Non-parametric tests can be used when data is not normally distributed. This means it does not rely on any data referring to any particular parametric group of probability distributions. Non-parametric methods are also called distribution-free tests since they do not have any underlying population.
There are various non-parametric tests that you can use in such situations. These tests provide alternatives to traditional statistical methods when dealing with data. One we will be looking at here is the sign test.
Statistical Tests: Sign Test
When conducting in-group studies, the sign test is utilized (just one group of participants). However, a “matched-pairs” approach might make use of two participant groups. When applied to categorical data, the sign test evaluates the difference between two conditions.
Statistical Tests: Sign Test Calculation
To calculate a sign test, imagine yourself as a researcher. You want to compare the anxiety levels of patients before and after receiving cognitive behavioural therapy (CBT) for a duration of 12 weeks. Let us look at how to calculate a sign test step-by-step with an example.
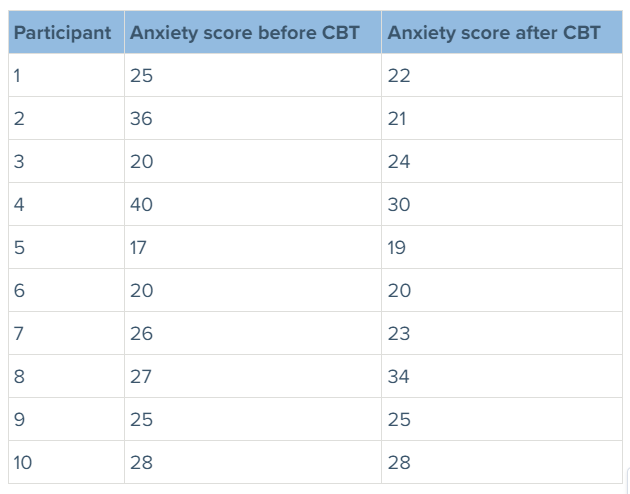
- Determine the difference between the two sets of data (the data will still produce the same results regardless of which column is added to or subtracted from).
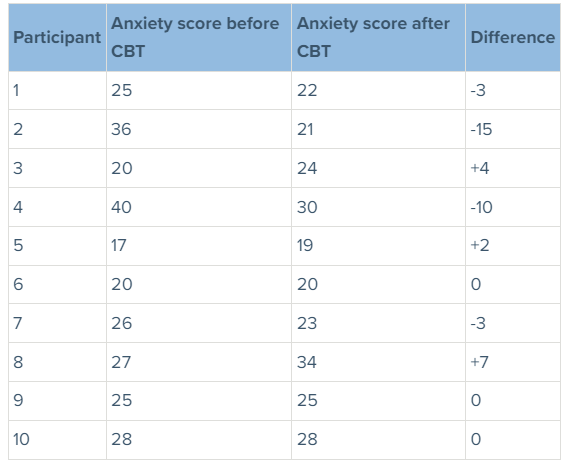
- Add up all of the “+” and “-” numbers. When there is no difference, ignore the data (i.e., the difference of 0).
According to the data, we have 3 “+” and 4 “-“
- ‘S-value’ is the less frequent sign. So, here, the value of S is ‘3’ because the ‘+’ was the less frequent sign, and there are a total of 3 ‘+’ values.
- We had a total of 10 participants and then minus the 3 that had a difference of 0. This is how we calculate the value of N, i.e., 10-3=7
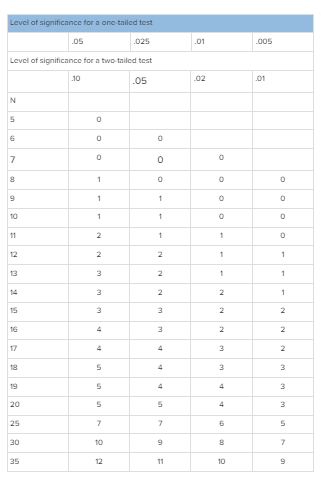
- To determine if it is significant, compare the calculated S-value to the critical value. Note: A critical values table will always be given in the exams.
Answers:
- In the above example, the study shown is two-tailed, which shows that there is a difference between positive and negative.
- The significance level is always .05 unless it is specified.
- In the above example, it is shown that the N-value is 7, and the critical value is 0.
- For the S-value to be considered significant, it needs to be either less than or equal to the critical value. The results in the above example show that it is insignificant; as you can see, the calculated value, i.e., 3, is greater than the critical value, i.e., 0.
Errors In Hypothesis Testing
Errors can happen during hypothesis testing. These errors affect the validity of the research findings. There are two main types of errors in hypothesis testing that researchers make:
Type 1 error: It occurs when researchers wrongly reject the null hypothesis, claiming that there is a significant effect in a relationship where there isn’t. This is also known as a false positive. It means the researcher concludes that something is happening when it is actually due to chance or random variation in data.
Type 2 error: It occurs when researchers mistakenly accept the null hypothesis and reject the alternative hypothesis when it is actually true. In other words, they miss the real effect or relationship that exists.
FAQs
- How can researchers determine what statistical test to use?
Researchers determine the statistical test based on their research question, data type, and assumptions. They consider factors like the type of variables, the number of groups being compared, and whether the data meets certain assumptions required by specific tests.
- What is a statistical test?
A statistical test is a method used to analyze data and determine whether there is a significant difference or relationship between variables. It helps researchers make inferences about the populations based on sample data.
- What are the types of statistical tests?
There are two types of statistical tests: Parametric and non-parametric tests.
- Parametric tests are used to distribute data and specific assumptions normally.
- Non-parametric tests are used for data that don’t meet parametric assumptions.
- How do you choose a statistical test?
The statistical test used depends on:
- Whether the assumptions of parametric and non-parametric tests have been met or not
- What the hypothesis seeks to analyze. For example, correlation tests are used when the study seeks to quantify the relationship between plant growth and sunlight exposure.
- What makes a test statistically significant?
Researchers can use significance tests to obtain a statistical value that indicates the possibility that study findings are a result of a chance. A value of less than .05 shows statistical significance in the results.
- Why is hypothesis testing used in psychology research?
Hypothesis testing is used in experimental research to determine whether the null or alternative hypothesis should be accepted.
Final Thoughts
In summary, statistical tests are tools we use to understand information from experiments. The two main types of statistical tests, including parametric tests and non-parametric tests. Parametric tests are used for average data, and non-parametric tests are for the data that is not normally distributed. It is also essential to know when to use statistical tests in psychology to make sense of and draw conclusions. These tests help researchers determine the reliability of their findings and evaluate if they can generalize their results to a wider population.
Online Paper Help assists researchers in getting the appropriate use of statistical tests. This enhances the validity and credibility of psychological research. Our experts can simplify complex concepts and make it easier for researchers to understand when statistical tests are appropriate for their studies. Contact us today and get the assistance you need for statistical tests in psychology.